
My Speculative Decoding Experiment: The Speedup, the Failed Launches, and the Measurement Bugs
I started this experiment wanting to compare a small draft model with EAGLE-3 on a quantized 32B language model. Neither neural drafting path completed startup. NGRAM speculation did run, and its median client-reported decode rate increased from 55.60 to 71.37 tokens per second.
That result was worth keeping. So were the failures. When I revisited the repository, I also found measurement and reporting problems that changed how confidently I could explain the numbers.
This is a case study of those saved experiments, reviewed at commit edabe866. It includes a later, separate TurboLLM session. The figures below are reconstructed from saved artifacts, without a new GPU benchmark run.
The question I wanted to answer
Ordinary decode advances a request through dependent token predictions. Speculative decoding tries to reduce the number of expensive target-model passes: a cheaper mechanism proposes several tokens, and the target evaluates candidate positions together.
The target still decides what gets committed. Drafting takes time, verification gets more expensive as the candidate batch grows, and rejected candidates waste work. A useful approximation for the decode phase is:
Here, is the number of output tokens committed per speculative cycle, including any target-generated correction or bonus token. is the ordinary time per token. The denominator is the time spent drafting, verifying, and coordinating one cycle. Speculation helps when that cycle produces enough useful output to repay its cost. The original speculative decoding paper explains the verification and sampling machinery.
My motivation was tensor parallelism over PCIe. With TP=2, the model's work is divided between two GPUs, and layers communicate during each target pass. Verifying several positions together can amortize some of that work. There are multiple collective operations across the model's layers, however. Describing this as one all-reduce for an entire token or verification cycle is too simple.
I also needed a profiler to establish whether communication was the actual bottleneck. A PCIe topology alone cannot prove that.
What I actually ran
The initial recipes targeted two RTX 4090s. The completed SGLang runs were recorded on two RTX PRO 4000 Blackwell GPUs, with 24,467 MiB per GPU and no NVLink. Those are different hardware configurations.
The lab notes record SGLang 0.5.19, FlashInfer 0.6.18, CUDA 13.0, and driver 595.71.05. The target was Qwen/Qwen2.5-32B-Instruct-AWQ, served with TP=2 and FlashInfer attention. Its checkpoint configuration specifies 4-bit AWQ weights. Some repository tables call it "INT8 AWQ"; that label should not be used to describe this checkpoint.
The client sent 90 prompts sequentially: 30 code, 30 prose, and 30 JSON tasks. Each configuration had two warmup requests, followed by one pass in the fixed order code, prose, then JSON. Temperature was zero. Output limits were 512 tokens for code and prose and 384 for JSON.
The prompt texts contain 14 to 57 whitespace-separated words. That is not a tokenizer measurement, but it is enough to reject the later description of this dataset as roughly 9,000-token prompts. This was a short-prompt, single-request-at-a-time experiment, not a long-context or concurrency stress test.
| Configuration | Intended change | Recorded outcome |
|---|---|---|
| Baseline | Ordinary target decoding | 90 requests completed |
| Standalone draft | Add Qwen2.5-1.5B-Instruct | Startup failure reported |
| EAGLE-3 | Add a target-specific neural draft | Graph-capture failure reported |
| NGRAM | Draft from previously seen token sequences | 90 requests completed |
| FP8 KV | Store the attention cache as fp8_e5m2 | 90 requests completed |
NGRAM needs no separate draft-model weights. It retrieves candidate continuations from an n-gram cache and asks the target to verify them. This made it a useful fallback, but its results answer a different question from the planned neural-draft comparison. SGLang documents the methods separately.
The results that survive the audit
The three committed client logs each contain 90 observations. Their printed summaries report:
| Configuration | Median client decode rate | Median TTFT | Ratio of median rates |
|---|---|---|---|
| Baseline | 55.60 tokens/s | 34.9 ms | 1.00× |
| NGRAM | 71.37 tokens/s | 37.6 ms | 1.28× |
| FP8 KV | 54.77 tokens/s | 35.5 ms | 0.985× |
TTFT here means the client's wait for the first non-empty content chunk. "Client decode rate" is the harness's own metric, examined below. These are descriptive results from one saved pass per configuration, rather than uncertainty estimates from independent repeated runs.
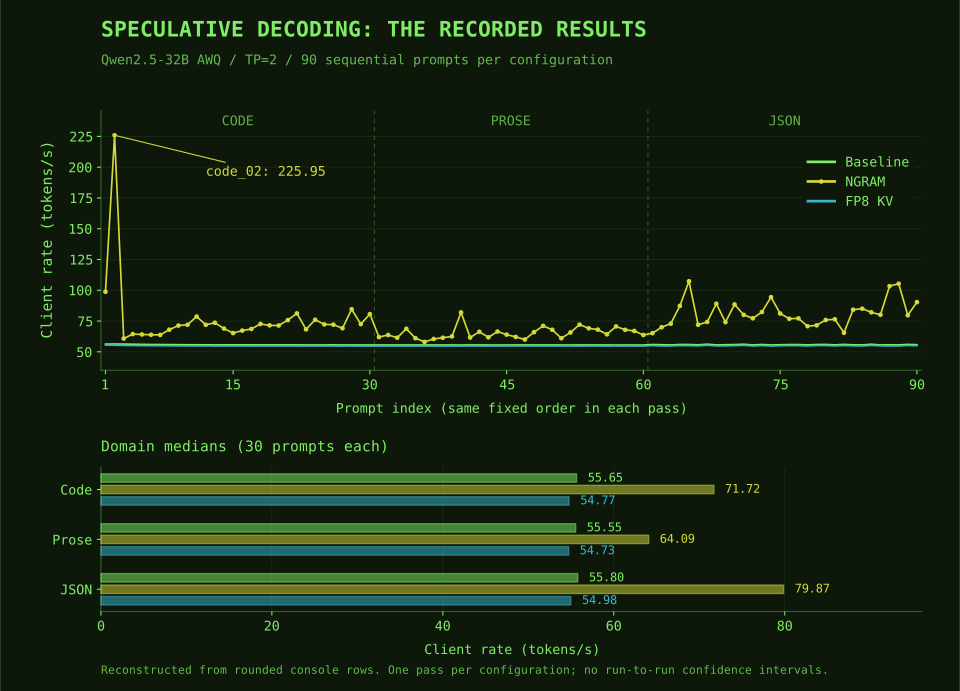
The domain medians reconstructed from those rounded rows are:
| Domain, 30 prompts each | Baseline | NGRAM | FP8 KV |
|---|---|---|---|
| Code | 55.65 | 71.72 | 54.77 |
| Prose | 55.55 | 64.09 | 54.73 |
| JSON | 55.80 | 79.87 | 54.98 |
All values are tokens/s. Small rounding differences from the original full-precision summaries are expected.
JSON had the highest NGRAM median. Code included the fastest individual request: code_02, at 225.95 tokens/s. I would keep that observation in the plot, but I would not use it as the typical speedup or call it proof of a particular acceptance rate.
There is a cache confounder here too. The warmup uses the first two dataset prompts, which are then measured again. code_02 is one of them. There is no explicit cache reset or randomized order in the client. That does not explain the outlier by itself, but it prevents a clean claim that every request was cold and independent.
Failure one: the smaller model did not fit the draft interface
The standalone path paired the 32B target with Qwen/Qwen2.5-1.5B-Instruct. The experiment notes report rejection at initialization because the target has 152,064 vocabulary entries and the draft has 151,936. Those dimensions are independently visible in the target and draft configurations.
The practical lesson is that a shared model-family name is not a compatibility check. Token IDs, special-token handling, output vocabulary dimensions, and the engine's supported mapping must agree. Equal vocabulary sizes alone would not guarantee equivalent token meanings either. I would not try to solve this by padding a tensor until a shape assertion passes.
The saved failure description is available, but the original SGLang startup trace is not committed. I can report the documented failure and verify the checkpoint dimensions. I cannot reconstruct the full failing call path from this snapshot.
There is no standalone throughput result to compare with NGRAM or EAGLE-3.
Failure two: EAGLE-3 stopped during graph capture
The notes describe an EAGLE-3 failure during prefill CUDA graph capture, with a Cutlass/TVM tensor dtype mismatch and expected dtype=float16. They also record retries with a different graph backend, a smaller memory fraction, and fewer speculative steps.
A CUDA graph records GPU work so the engine can replay it with less launch overhead. A failure while capturing that work means this launch path did not become usable. It does not tell me whether EAGLE-3 would have been fast after startup.
The raw failure trace and a minimal reproducer are absent. I therefore cannot establish whether the underlying defect was architecture-specific, quantization-specific, a draft precision mismatch, or a particular interaction in that software stack. I would preserve the reported symptom and avoid promising that a particular later SGLang release fixes it without a matching upstream change and a successful retest.
This was a compatibility failure in the recorded setup. The algorithm comparison remained unfinished.
FP8 KV: a negative result with a narrow scope
The FP8 KV configuration was about 1.5% slower by the ratio of printed median rates. That is a useful observation for this workload. It does not establish a universal penalty for FP8 KV caching.
For conventional attention, cache storage scales with layers, KV heads, head size, context length, and bytes per stored value. Reducing a two-byte value to one byte reduces that part of the logical cache footprint. SGLang's quantized KV guide also describes scaling and backend considerations.
This test did not exercise the long contexts or concurrent sequences where cache pressure might matter more. Nor was it a perfectly isolated dtype comparison: the recorded baseline used --mem-fraction-static 0.82, while the FP8 and NGRAM runs used 0.85.
That distinction also matters when reading allocated VRAM. An engine may spend saved cache bytes on more token slots rather than return that memory to the driver. The difference between two nvidia-smi memory readings is not automatically the memory cost of an algorithm.
I can say that FP8 KV did not improve the saved single-stream rates. I cannot attribute the entire difference to dequantization overhead, or claim a measured concurrency benefit, without the corresponding experiments.
The benchmark needed debugging too
The CSV schema was broken
At the reviewed commit, the CSV header declares 14 columns. The row writer supplies 10 values. It omits config_name, model, prompt_id, and category.
Reading those rows under the declared header shifts numeric values into the wrong fields. I would fix this with a named-field writer and an assertion that every record matches the schema before it is saved.
The original per-request CSV is absent from the reviewed commit, as are the SGLang GPU telemetry CSVs referenced by the reports. The repository's ignore rules exclude those files. I reconstructed the 270 observations from console output instead. That reconstruction contains counts and rounded timings; it cannot recover missing output text, full precision, or raw metric scrapes.
One detailed report also labels throughput-like numbers as TTFT seconds. The console summaries report TTFT in milliseconds. I use the console's explicit timing labels here and leave the unavailable CSV unrepaired.
The rate was a client measurement
The harness computes:
is the entire completion token count. The clock starts at the first non-empty streaming content chunk and stops after the stream finishes. This includes delivery and stream-finalization behavior, and the numerator includes tokens that have already arrived in that first chunk. A speculative chunk can contain multiple tokens.
If the server omits token usage, the client falls back to counting whitespace-separated words. Those are not tokenizer tokens. The saved console lines do not record whether a count came from server usage or the fallback.
These details do not automatically erase the observed NGRAM advantage. They do limit comparisons with kernel benchmarks and other serving clients. A revised harness should require authoritative token counts and record chunk boundaries and their semantics. SGLang's production metrics documentation is useful for distinguishing request-level TPOT from other timing averages.
Acceptance was not established
The metric scraper stores Prometheus sample names together with their labels, then later looks up bare names. A sample such as metric_name{model_name="..."} will not match a lookup for just metric_name. The code also treats a zero counter delta as missing, which loses the distinction between zero acceptance and unavailable data.
There is a denominator problem to check as well: accepted tokens per request is different from accepted tokens per verification step. The server's metric definitions and labels need to be captured with the run.
None of the saved progress lines contains an acceptance-rate result. I can compare observed rates by domain. I cannot turn that into a measured claim that JSON had the highest draft acceptance.
Temperature zero was not an output-equivalence test
Compared by prompt ID, 13 NGRAM requests and 24 FP8 requests have different completion lengths from baseline. The client receives the output text but does not persist it in the CSV or console log.
That leaves several questions open: were the answers equivalent, were JSON outputs valid, and did numeric or verification differences change generation? Different lengths do not diagnose the cause, but they mean I cannot assume identical outputs just because temperature was zero.
The commit history contains another useful warning: --limit 0 originally selected an empty slice. That bug was fixed before the saved 90-request runs. A benchmark should still assert its completed-request count, rather than treat a successful startup or warmup as a completed experiment.
The later TurboLLM session was a different experiment
The repository also preserves a single RTX 6000 Ada, 48 GB session from September 18 and 19. TurboLLM attempted to start an unquantized BF16 model under vLLM, then served an IQ3_S GGUF model through llama.cpp's Vulkan backend, with MTP speculation enabled.
The vLLM trace is direct failure evidence: it reports 47.36 GiB total capacity, 47.30 GiB in use, and failure to allocate another 60 MiB while constructing model weights. A nominal 27-billion-parameter BF16 model needs roughly 54 GB for two-byte parameters before other allocations. That simple budget already makes a fully resident, unquantized launch on this card suspect.
The artifact calls the model Qwen3.8-27B; vLLM resolves its architecture as Qwen3_5ForConditionalGeneration. I would preserve both identifiers and require checkpoint provenance before making a broader model-family claim. Reducing the context limit alone is not evidence of a fix for a failure that occurs while allocating weights.
The saved TurboLLM presets record:
| IQ3_S autotune configuration | Recorded decode rate |
|---|---|
f16 KV, 8,192 context, 65 offloaded layers | 26.29 tokens/s |
q8_0 KV, 8,192 context, 65 offloaded layers | 23.86 tokens/s |
These are autotune results, not the 90-prompt SGLang protocol. The hardware, checkpoint, quantization, backend, and workload changed. There is also no matched MTP-off run, so the serving log's MTP initialization does not measure MTP speedup.
The session includes an application-level empty-visible-response recovery message after thinking blocks were stripped. That is another reason to distinguish first generated token from first useful visible output. The archived state, engine logs, and SQLite statistics provide different views of that session; usage counters alone are not completed benchmark requests.
How I would repeat the study
I would first make the measurement pipeline fail loudly on missing evidence, then expand the experiment:
| Step | Control or artifact I need |
|---|---|
| Validate the client | Named CSV fields, exact token usage, saved outputs, metric-parser fixtures, asserted request counts |
| Freeze the environment | Container digest, package versions, target/draft/tokenizer revisions, resolved launch arguments |
| Check compatibility cheaply | Model dimensions and token mappings, then a short startup and generation test per draft path |
| Repeat the speed comparison | Matched memory settings, explicit cold/warm cache policy, randomized order, repeated passes |
| Check output behavior | Paired output comparisons, JSON validation, task-specific checks before interpreting speed |
| Locate the bottleneck | Profiler traces aligned to requests and collective operations, rather than inferred link bandwidth |
| Test the capacity hypothesis | Context-length and concurrency sweeps with TTFT and TPOT distributions, failures, and memory accounting |
I would save raw scrapes and timestamped telemetry with the results, and export them before destroying a rental. A reasonable stopping rule for a failed draft path is a recorded error, a minimal reproducer, and a bounded set of diagnostic changes. Repeating unrelated tuning flags should not consume the whole experiment.
The H200, disaggregation, hybrid-state, and concurrency experiments under plans/ remain plans in this snapshot. Their estimated numbers do not belong in the measured-results table.
What I take from it
NGRAM improved the recorded client rate on this prompt set. Standalone drafting and EAGLE-3 remained unmeasured because their launches failed. FP8 KV did not improve the tested single-stream rate, and the later TurboLLM session needs its own baseline.
The change I would make first is the evidence pipeline. I want to be able to explain every plotted number, recover its request and configuration, check its output, and point to the artifact behind a failure. That would make the next speedup much easier to trust.
Sources and reproducibility
- Reviewed repository snapshot: scripts, datasets, plans, reports, archived state, and engine logs.
- Saved client observations: baseline, NGRAM, and FP8 KV.
- Benchmark client at the reviewed commit, including timing, token-count fallback, metric parsing, and CSV serialization.
- TurboLLM state and logs, including saved autotune presets in
config.json. - SGLang speculative decoding, production metrics, and quantized KV cache: current implementation guidance, separate from the historical run environment.
- Leviathan, Kalman, and Matias, ICML 2023: speculative decoding and target verification.
The companion audit files record the pinned commit, hashes of all 44 tracked source files, reconstructed observations, and evidence limitations. utils/audit_sglang_benchmark.py rebuilds them from that clone; utils/generate_sglang_study_figure.py rebuilds the three themed plots.
About the author
Ritesh Yadav works as an AI/ML Engineer. He writes independent research notes on ML performance, infrastructure, and systems, covering CUDA, low-latency inference, generative AI, distributed training, Kubernetes, and LLMOps.