
Serving LLMs on Kubernetes: From API to GPU
Getting a model to answer one prompt feels like the hard part. Then a second team starts using it, prompts get longer, and a rolling update needs GPUs that are already occupied.
Now the questions change. Who can use the model? Which replica should receive a request? Why is the queue growing when CPU usage is low? And why did adding a replica fail to add any usable capacity?
While studying LLM serving on Kubernetes, I found it easier to follow one request through the system than to start with a list of tools. This post takes that approach, then works outward to GPU placement, model startup, autoscaling, and monitoring.
This is an architecture walkthrough based on upstream documentation, not a report of a production deployment I have benchmarked. The KServe examples follow its 0.20 documentation, checked in October 2026. Installation details depend on a compatible set of component releases.
Start with the model server
Inference means running a trained model to produce an answer. A model server such as vLLM accepts requests, runs the model, and returns generated tokens. Tokens are the pieces of text the model processes, often parts of words.
In Kubernetes, that server runs inside a pod, the unit Kubernetes schedules onto a machine. The machine is a node. A GPU node has accelerators available to the pod.
A replica is another instance of the serving workload. Two independent replicas can handle different requests at the same time. A replica can also use several GPUs when the model needs them. Replica count and GPU count are different settings.
Kubernetes can place pods and restart failed ones. Choosing a replica based on its attention cache or attributing usage to a team requires additional serving components.
Follow a request to the GPU
Imagine an internal coding assistant with a public model alias called coder. Its request might look like this:
{
  "model": "coder",
  "messages": [
    {
      "role": "user",
      "content": "Explain this Python function."
    }
  ],
  "max_tokens": 512,
  "stream": true
}
The alias lets the application use a stable name while the platform changes the model behind it. Here is one way to organize the request path.
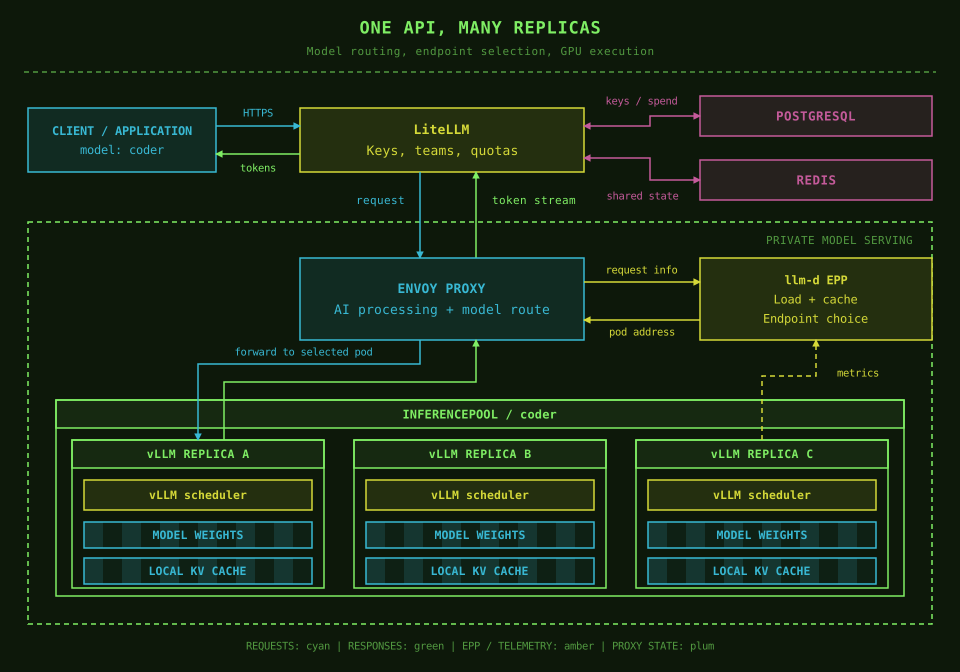
There are three decisions along this path:
- May this caller use
coder? LiteLLM checks the caller's key and configured access, quota, and budget policies. - Which model pool serves
coder? The internal gateway matches the requested model to a backend pool. - Which replica in that pool should do the work? The llm-d Endpoint Picker chooses an endpoint using its configured policy and available server state.
Envoy then forwards the request to the selected vLLM server. With streaming enabled, pieces of the response travel back through Envoy and LiteLLM as they become available.
An InferencePool is a Kubernetes resource describing a group of eligible model-serving pods. It is not another proxy that the request must pass through. The gateway asks the pool's Endpoint Picker, usually shortened to EPP, for a destination. The picker returns the address, and the gateway forwards the request. This separation is described in the Gateway API Inference Extension request flow.
Where Envoy Gateway and Envoy AI Gateway fit
The names can make this look like several proxies in a row. Envoy Proxy handles connections and forwarding. Envoy Gateway turns Kubernetes gateway configuration into proxy configuration. Envoy AI Gateway adds AI-specific processing, including model extraction, API transformations, and token-usage handling through an external processor.
These capabilities can work around the same Envoy proxy. They do not inherently require a separate Envoy hop for each product name. The AI external processor and the llm-d EPP also have different jobs: one handles AI API processing; the other chooses a serving endpoint.
One naming update: Envoy AI Gateway is now called Agent Router. The project says its existing CRD names and aigateway.envoyproxy.io API group remain unchanged. I use the older name here where it matches KServe's integration guide. See the rename announcement and data-plane documentation.
Let KServe maintain the service
So far, we have followed live traffic. Someone still needs to create the model pods, their GPU requests, and the routing resources.
This is where KServe fits. Its LLMInferenceService resource describes the desired model-serving setup. A controller watches that description and creates or updates the resources needed to match it. Kubernetes calls this process reconciliation.
Think of the description as an instruction to maintain two replicas. If a pod disappears, the workload controller works to restore that desired count. This management activity belongs to the control plane. The proxies and model servers handling actual requests form the data plane.
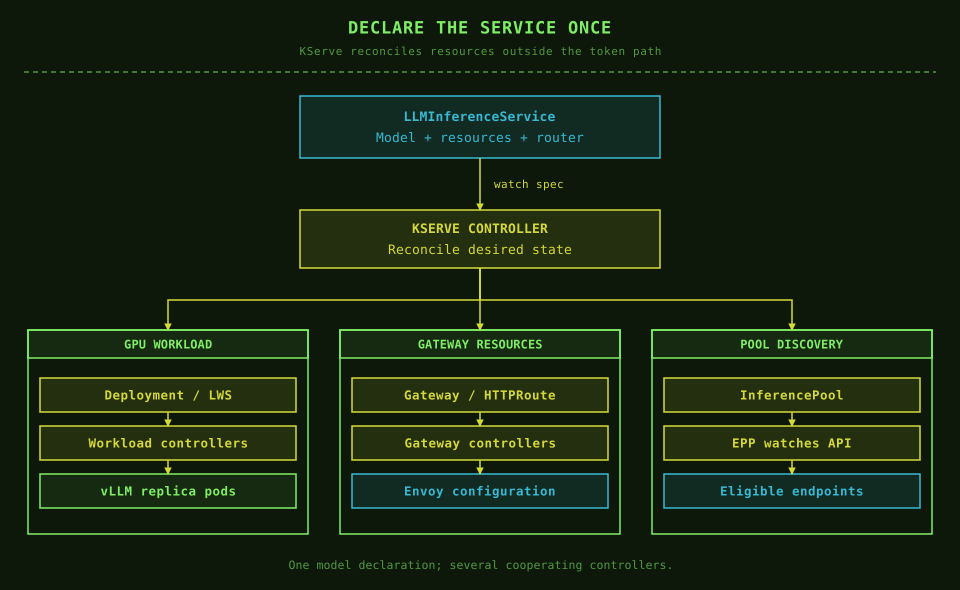
KServe's generative serving API builds on llm-d's architecture. The division is useful: KServe manages the declared service; llm-d supplies inference-aware routing and distributed-serving components; vLLM executes the model. KServe itself is not a step through which every generated token passes. Its overview explains these relationships.
For example, this excerpt describes two single-GPU replicas of a model exposed as coder:
apiVersion: serving.kserve.io/v1alpha1
kind: LLMInferenceService
metadata:
  name: coder
  namespace: models
spec:
  model:
    uri: hf://Qwen/Qwen2.5-7B-Instruct
    name: coder
  replicas: 2
  template:
    containers:
      - name: main
        resources:
          requests:
            cpu: "4"
            memory: 32Gi
          limits:
            cpu: "8"
            memory: 32Gi
            nvidia.com/gpu: "1"
The namespace, KServe dependencies, serving image defaults, storage credentials, and router configuration must already be set up. This is a service-specification example, not a complete cluster installation. The GPU limit is also used as its request when a separate GPU request is omitted.
The configuration guide supports reusable LLMInferenceServiceConfig fragments through baseRefs. A platform team can maintain accelerator and router defaults while each model declares its own identity and capacity. Pin the serving image and model revision through the mechanisms supported by the selected release.
A single-node workload can use a Deployment, Kubernetes' controller for maintaining replica pods. For a distributed replica, LeaderWorkerSet (LWS) groups a leader pod with cooperating worker pods. Several pods can therefore belong to one model replica rather than each being an independent copy.
Separate the three scheduling decisions
The word scheduler shows up at several layers. Keeping them separate helped me understand what each optimization can actually change.
The Kubernetes scheduler places a pod on a compatible node. The EPP assigns an inference request to a serving replica. The vLLM scheduler decides which token work runs in the next engine iteration inside that replica.
That last decision happens repeatedly during generation. vLLM can use continuous batching: finished requests leave, and new work can join between iterations as capacity becomes available. A short request does not have to remain attached to a fixed batch until every longer request finishes.
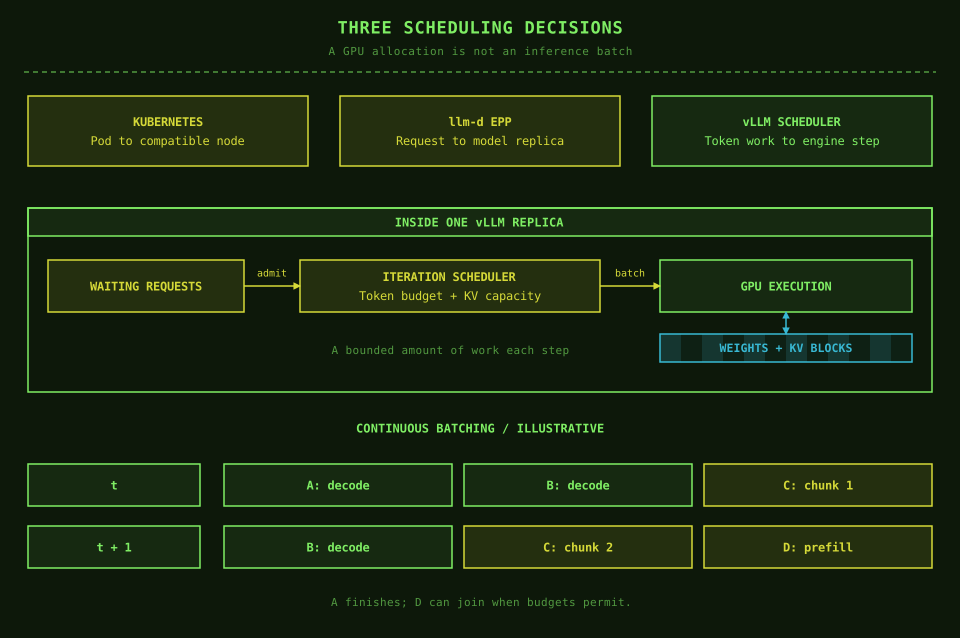
In the example, A and B are decoding while C processes a prompt chunk. After A finishes, B and C continue, and D can join if the scheduler has room. These are conceptual batches, not measured execution times.
Chunked prefill breaks a long prompt into smaller pieces so prompt processing can share iterations with ongoing generation. In vLLM V1, where supported, the documented policy prioritizes decode work and uses the remaining token budget for prefill. The tuning guide describes the latency trade-offs.
Two settings answer different questions: max_num_batched_tokens limits token work per iteration; max_num_seqs limits the sequences processed in an iteration. Neither is a replacement for the model's context limit or a guarantee that every configured sequence will fit in KV memory. See the scheduler configuration.
This is why I would inspect both replica routing and runtime batching when diagnosing latency. A well-placed pod can still receive too much work, and a well-chosen replica can still have an expensive next iteration.
Plan GPU placement and memory
Make the hardware visible to Kubernetes
The NVIDIA GPU Operator manages the NVIDIA software needed on GPU nodes, including drivers, the container toolkit, the device plugin, discovery, and monitoring components, depending on its configuration. The device plugin exposes schedulable GPU resources such as nvidia.com/gpu. The Operator does not provision physical GPUs or manage AMD's software stack. See NVIDIA's component overview.
In a mixed cluster, use node labels to select suitable hardware. A small model and a large model may need different GPU memory capacities or interconnects.
A taint can reserve a GPU node against pods that have not opted in. A toleration permits a pod onto that tainted node; it does not select that node. A node selector or affinity rule supplies the selection. Check the actual labels on the cluster rather than copying an example GPU product string. Kubernetes documents the GPU resource and placement rules.
Budget for the model while it is running
Weights are only one part of device memory:
GPU memory needed = weights + KV cache + temporary workspaces + runtime overhead + headroom.
As a rough calculation, eight billion parameters at two bytes each occupy about 16 GB of raw weights. That does not mean a 16 GB GPU can serve the model. Loading and running it need additional memory.
The KV cache stores attention keys and values from processed tokens so the model can reuse that work during generation. Longer contexts and more simultaneous sequences generally increase the state the server must retain. I cover the mechanism in Prefill and Decode.
Set context limits intentionally. With a total serving limit of 32,768 tokens, a 28,672-token input leaves at most 4,096 tokens for output. The input count includes the formatted conversation, system prompt, and tool definitions. Advertising the limit in a proxy configuration is not enough; verify that admission checks and the runtime enforce the same contract.
vLLM's --gpu-memory-utilization tunes its memory budget. It does not create isolation from another process on the GPU. Under KV-cache pressure, the engine may preempt work and recompute it later, increasing latency. The vLLM tuning guide explains that behavior.
Sharing and parallelism solve different problems
Tensor parallelism splits model tensors and their computation across GPUs. Those GPUs cooperate on one replica, so their interconnect matters. Two replicas using two GPUs each need four GPU allocations, plus any spare capacity for an update.
GPU sharing changes how workloads use a device. MIG, on supported NVIDIA hardware, partitions it into instances with dedicated memory and hardware isolation. Time-slicing lets workloads share execution time, but does not give each one an isolated VRAM partition. A schedulable slot is not automatically a safe memory budget. NVIDIA's sharing guide makes this distinction explicit.
Route using load and cache state
An HTTP connection count says little about how much LLM work remains. A request producing a short answer and one producing thousands of tokens both occupy connections.
The llm-d EPP can use signals such as waiting requests, active requests, KV-cache utilization, and cached-prefix locality. Its plugins determine how those signals affect selection. The proxy consults it using Envoy's external processing protocol, or ext_proc. Request information can be inspected during that exchange; the EPP's endpoint decision directs the proxy's forwarding. See the llm-d EPP design.
Prefix locality means a replica already holds reusable attention state for the beginning of a prompt. Suppose many requests begin with the same long coding instructions. Sending them to a replica with that prefix cached can avoid recomputing those prompt tokens.
There is a trade-off:
| Candidate | Cached shared prefix | Current queue | What to consider |
|---|---|---|---|
| Replica A | Available | Long | Saves prompt computation, but adds waiting |
| Replica B | Missing | Short | Recomputes the prefix, but can start sooner |
These are illustrative states, not benchmark results. Either replica could be the better choice. Routing policy has to balance saved work against load rather than always favoring a warm cache. Cache information can also change before the request arrives.
Prefix caching reuses computed state, not a previously written answer. The new question still needs processing and the answer still needs generation. vLLM's prefix-caching guide explains why its direct benefit is in prefill rather than speeding up each decode step.
Distinguish model readiness from cache warmth
There are several kinds of "ready" state:
| State | What is already available | What still has to happen |
|---|---|---|
| Weights cached on disk | Checkpoint files | Load and initialize the serving process |
| Model ready on the GPU | Weights and runtime allocations | Process an uncached prompt |
| Relevant prefix cached | Reusable attention state | Process the unmatched suffix and generate the answer |
A new replica may have the weights cached locally and pass readiness while lacking the prefixes used by the existing replicas. It adds execution capacity immediately after becoming ready, but useful prefix locality has to develop or come from an explicitly configured KV-sharing mechanism.
That creates an interesting scale-out trade-off. Moving repeated prompts to a new replica can reduce queueing while temporarily increasing prompt computation. I would compare queue time and prefix-hit rate together during a rollout, rather than treating either one as the whole result.
Shared caches also need a deliberate tenant policy. vLLM supports cache_salt, which scopes prefix reuse to requests carrying the same salt. A trusted gateway should set or validate that value for the intended sharing group. It reduces a specific cache-sharing risk; it does not isolate tenants sharing the same runtime or GPU. Separate instances may be required for stronger isolation. The vLLM security guide explains these boundaries.
Where prefill-decode disaggregation fits
Prefill processes the input; decode generates the continuation. A basic replica handles both. Disaggregation assigns them to separate worker pools and transfers the prompt's KV state between them.
This can isolate different scheduling demands and let each pool scale independently. It also introduces transfer latency, networking requirements, and more failure cases. It is a workload-dependent optimization to evaluate after measuring the simpler setup. The separate disaggregation post explains that trade-off in more detail.
Manage access and usage with LiteLLM
The endpoint picker knows about servers. It does not know whether the engineering team should have access to an expensive model.
LiteLLM virtual keys give applications or teams their own credentials with configured model access, budgets, and rate limits. Requests per minute control request frequency. Tokens per minute account for request size more directly. Neither is the same as a monetary budget. The virtual-key guide explains the key and team model.
For a multi-replica LiteLLM deployment, PostgreSQL, a relational database, holds durable data such as keys, teams, configuration, and spend records. Redis, a fast shared key-value store, supplies rate-limiting and router state across instances. Current spend counters may be checked in Redis and reconciled with the database, so the database need not sit synchronously on every token's return path. Follow the production deployment guide for the chosen deployment mode.
For self-hosted models, configure an intentional cost model if budgets depend on spend. A dollar limit is ineffective for a model configured as free. Accounting cost per token is also not a measurement of the fleet's electricity, idle GPUs, or total infrastructure bill.
Budget behavior under concurrency and datastore failure matters. LiteLLM documents reservation and fail-closed options for stronger enforcement. Test the selected release with Redis and PostgreSQL unavailable rather than assuming a budget field alone guarantees a hard ceiling. See its budget-enforcement documentation.
Define public and internal boundaries
Clients should reach the public API through HTTPS. In this design, the inference gateway and model pods stay internal, so callers cannot bypass LiteLLM's tenant checks.
Give LiteLLM a separate service credential for the internal gateway, held in a Secret, and enforce it with a supported gateway authentication policy. Pair this with network restrictions, including a NetworkPolicy where the cluster's networking implementation enforces it. End-user keys and this service credential serve different boundaries. Envoy Gateway documents API-key authentication through SecurityPolicy.
The model alias must agree across LiteLLM, gateway routing, and the runtime's served-model name, unless an explicit rewrite connects them. KServe's AI Gateway integration shows model extraction into x-ai-eg-model and routing to an InferencePool. Derive identity and routing headers at trusted boundaries; a client-supplied team header is not proof of team membership.
That guide also shows token-usage metadata. Counting tokens enables policies and reporting, but does not by itself assign prices or enforce a tenant budget. Keep policy ownership explicit across the two gateway layers.
Decide which controller owns each route. A shared AI Gateway route and an automatically managed KServe route should not create unintended overlapping public paths. Also check the installed APIs: the stable InferencePool API uses inference.networking.k8s.io/v1, while some integration examples use the older experimental group. Use manifests supported by the actual installation, as the InferencePool reference describes.
Autoscaling has two separate jobs
Adding a pod and adding a ready GPU server are different operations.
First, the platform decides that the existing replicas need help. CPU usage alone is a poor description of that need: a server can have spare CPU while GPU execution or KV-cache capacity limits its progress.
Prometheus collects time-series measurements from servers. KServe's Workload Variant Autoscaler, or WVA, reads inference metrics from it and computes a desired replica count through the spec.scaling integration.
The Horizontal Pod Autoscaler (HPA) is Kubernetes' workload-scaling controller. KEDA connects external metrics and event sources to autoscaling, using an HPA for ordinary horizontal scaling. In KServe's WVA path, the selected actuator applies WVA's decision. These are not three independent controllers voting on the same replica count.
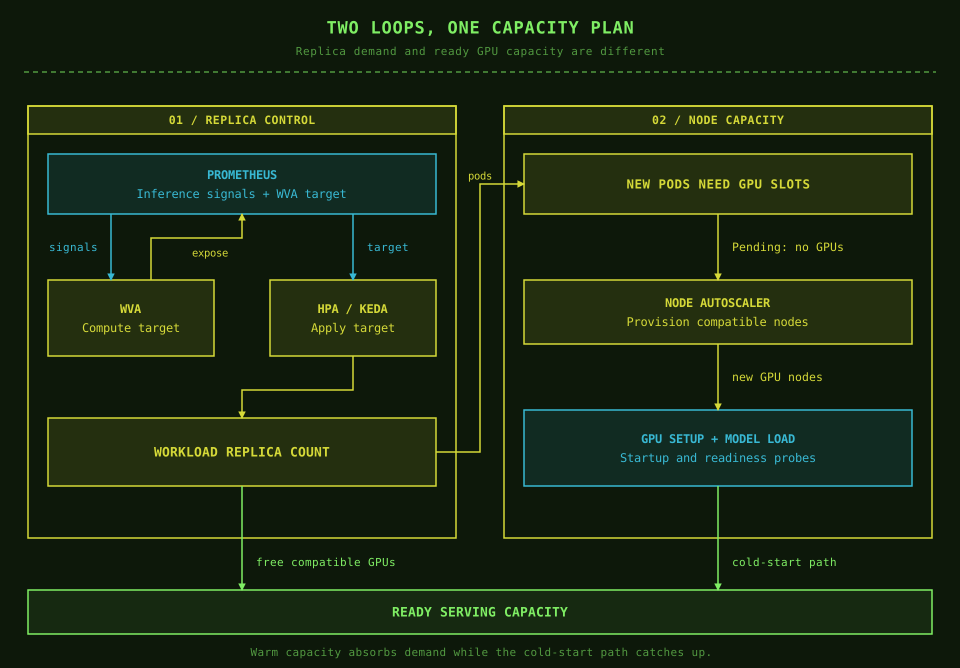
KServe treats dynamic spec.scaling and fixed spec.replicas as mutually exclusive. Use one supported scaling path for each workload. Its WVA guide covers the prerequisites and actuator choices.
Prometheus must see both sides of that loop: the inference metrics WVA reads and the desired-replica metric WVA exposes for the actuator. A healthy Prometheus process alone does not establish that the required targets are being scraped or that their samples are fresh.
For a Deployment managed directly with a KEDA Prometheus scaler, scope the query to that workload and ensure it returns one value. A cluster-wide queue sum can make unrelated models scale together. Metric target semantics matter too, so use the KEDA scaler reference rather than guessing a threshold.
Second comes node scaling. If new pods cannot find compatible free GPUs, they remain Pending. A supported node autoscaler can provision capacity for those unschedulable pods, subject to node-pool rules, quotas, and hardware availability. Kubernetes explains this workload-to-node scaling relationship. On premises, adding physical machines needs a separate capacity process.
Even after a node appears, its GPU software must become usable, the model must load, and readiness checks must pass. Warm replicas and spare capacity absorb traffic during that delay. Scale-to-zero trades idle cost for a cold start; it suits workloads that can tolerate the wait.
A bigger queue is not more capacity
Suppose requests arrive at 100 per second while the fleet can finish only 80 per second for that workload. Ignoring variability and rejection, the backlog grows by roughly 20 requests each second, or 1,200 in a minute. This is an illustrative calculation, not a benchmark of these tools.
Increasing the timeout lets those requests wait longer. It does not change how quickly the GPUs finish them. Autoscaling can help, but its response includes detection, scheduling, and startup time.
That is why I would pair scaling with admission control, a decision about how much work to accept before queues become unmanageable. Bound prompt and output sizes, limit waiting work, and return a clear overload response when necessary. Tenant rate limits help fairness; runtime queue and memory limits protect a different boundary.
Retries need a budget too. If every timed-out request immediately returns as another attempt, the extra traffic can worsen the overload. Propagate cancellation and test that abandoned requests stop consuming backend work through the complete proxy chain.
Account for model storage and rollouts
A model checkpoint is a startup dependency. Repeatedly downloading large weights from a public repository makes recovery depend on download speed and availability.
Pin model revisions, warm required files, and choose storage that supports the placement plan: node-local NVMe, a suitable persistent volume, or controlled object storage. A local cache helps only on nodes where the files exist. Measure both a warm restart and startup on a completely new node.
KServe has a Local Model Cache feature. Its guide describes InferenceService integration; verify support and wiring for the chosen LLMInferenceService release instead of assuming the same manifest enables caching everywhere.
Allow startup probes enough time for initialization, and make readiness mean the replica can actually serve. Before updating a model, account for the temporary GPUs needed to run old and new replicas together. Otherwise an update can stall while waiting for capacity.
During removal, stop assigning new work and allow active streams to finish within a deliberate termination window. A PodDisruptionBudget limits supported voluntary evictions; it cannot prevent a hardware failure or replace the workload's rollout policy. Kubernetes documents those disruption boundaries.
Measure queueing and response latency
I would start with two latency measurements:
- Time to first token (TTFT): the wait until the first generated token arrives. At the client, this includes the proxy path, queueing, and prompt processing.
- Inter-token latency: the gaps between subsequent generated tokens. A response can start quickly and still feel slow if those gaps are large.
A service-level objective, or SLO, sets the acceptable experience. For example, at least 95% of requests might need their first token within a chosen time limit. The 95th percentile, usually written p95, is the value at or below which 95% of observations fall.
Then connect the user experience to the system:
| Signal | Question it helps answer |
|---|---|
| vLLM waiting/running requests, KV usage, preemptions | Is the model server saturated or short of cache capacity? |
| Prefix hits and queries | Is routing finding useful reusable state? |
| Gateway errors and route/backend latency | Is the request reaching a healthy model endpoint? |
| LiteLLM key/team usage and spend | Who is consuming capacity or reaching a policy limit? |
| GPU utilization, memory, temperature, hardware errors | Is the device active and healthy? |
| Pending pods, readiness, restarts, node conditions | Why has requested capacity not become usable? |
vLLM exposes Prometheus metrics including vllm:num_requests_waiting, vllm:num_requests_running, vllm:kv_cache_usage_perc, and vllm:time_to_first_token_seconds. Despite its name, the KV gauge uses 1.0 to mean 100%. Metric names and labels must match the installed version. See the metrics reference.
For example, if the model_name label is present, this PromQL query shows total waiting requests per model:
sum by (model_name) (
  vllm:num_requests_waiting
)
Keep per-pod views too. A fleet total can hide one overloaded replica beside an idle one. vLLM's own latency excludes parts of the client path, so measure at the public endpoint as well.
For NVIDIA hardware, DCGM Exporter provides GPU telemetry to Prometheus. Workload attribution needs the appropriate Kubernetes metadata configuration. High GPU utilization alone does not establish that users are receiving timely answers.
I would also track goodput: the rate of successful requests that meet the chosen latency objectives. If a system completes 100 requests per second but only 80 meet all of the required targets, its goodput under those targets is 80 requests per second.
This makes a batching trade-off visible. A configuration can produce more total tokens while making interactive streams too slow. vLLM's serving benchmark supports goodput measurements with request-level latency objectives. Report offered load, errors, rejections, and the targets alongside the number so an apparently better result cannot hide discarded or delayed work.
How I would validate the design
I would first establish one model's latency, throughput, memory use, and cold-start time. Then add replicas and check whether routing improves load distribution and useful prefix reuse. Tenant controls and scaling can be tested against that baseline.
Use realistic prompt lengths, output lengths, shared-prefix patterns, and concurrency. A short-prompt demo will not expose the same limits as long-context agent traffic.
Finally, exercise the path end to end: revoke a key, request an unknown model, send an oversized prompt, cancel a stream, interrupt a datastore, and remove a serving pod. Check request-body limits, total and idle timeouts, error handling, and usage accounting. A retry after streaming has started cannot transparently replace tokens the client has already received.
The useful outcome is a clear explanation for every wait or failure: a policy rejected it, a route failed, a replica queued it, or capacity was still starting.
What I take away
The stack becomes easier to reason about when each component has a clear job. LiteLLM governs callers and usage. Envoy handles the gateway path. llm-d helps select serving endpoints. KServe maintains the declared service. vLLM generates the answer.
For a small deployment, only add layers that solve a problem you have measured. As the fleet grows, the important work is making routing, memory, storage, and scaling agree on what usable capacity actually means.
References and further reading
This post started with Shubham Tatvamasi's production-serving architecture article. The explanation and diagrams here are my own, checked against these upstream sources:
- KServe: LLMInferenceService overview, configuration, AI Gateway integration, WVA autoscaling, and Local Model Cache.
- Routing: Inference Gateway request flow, InferencePool API, and llm-d Endpoint Picker.
- Envoy: AI request processing, Agent Router naming update, and gateway API-key authentication.
- LiteLLM: virtual keys, production deployment, and budget enforcement.
- vLLM: tuning and preemption, scheduler configuration, prefix caching, tenant and cache boundaries, serving benchmarks, and production metrics.
- GPU infrastructure: GPU Operator, MIG and time-slicing, and DCGM Exporter.
- Kubernetes and KEDA: GPU scheduling, LeaderWorkerSet, node autoscaling, pod disruptions, and Prometheus scaler.
About the author
Ritesh Yadav works as an AI/ML Engineer. He writes independent research notes on ML performance, infrastructure, and systems, covering CUDA, low-latency inference, generative AI, distributed training, Kubernetes, and LLMOps.